SP500 LDN TRADING UPDATE 9/3/26

SP500 LDN TRADING UPDATE 9/3/26
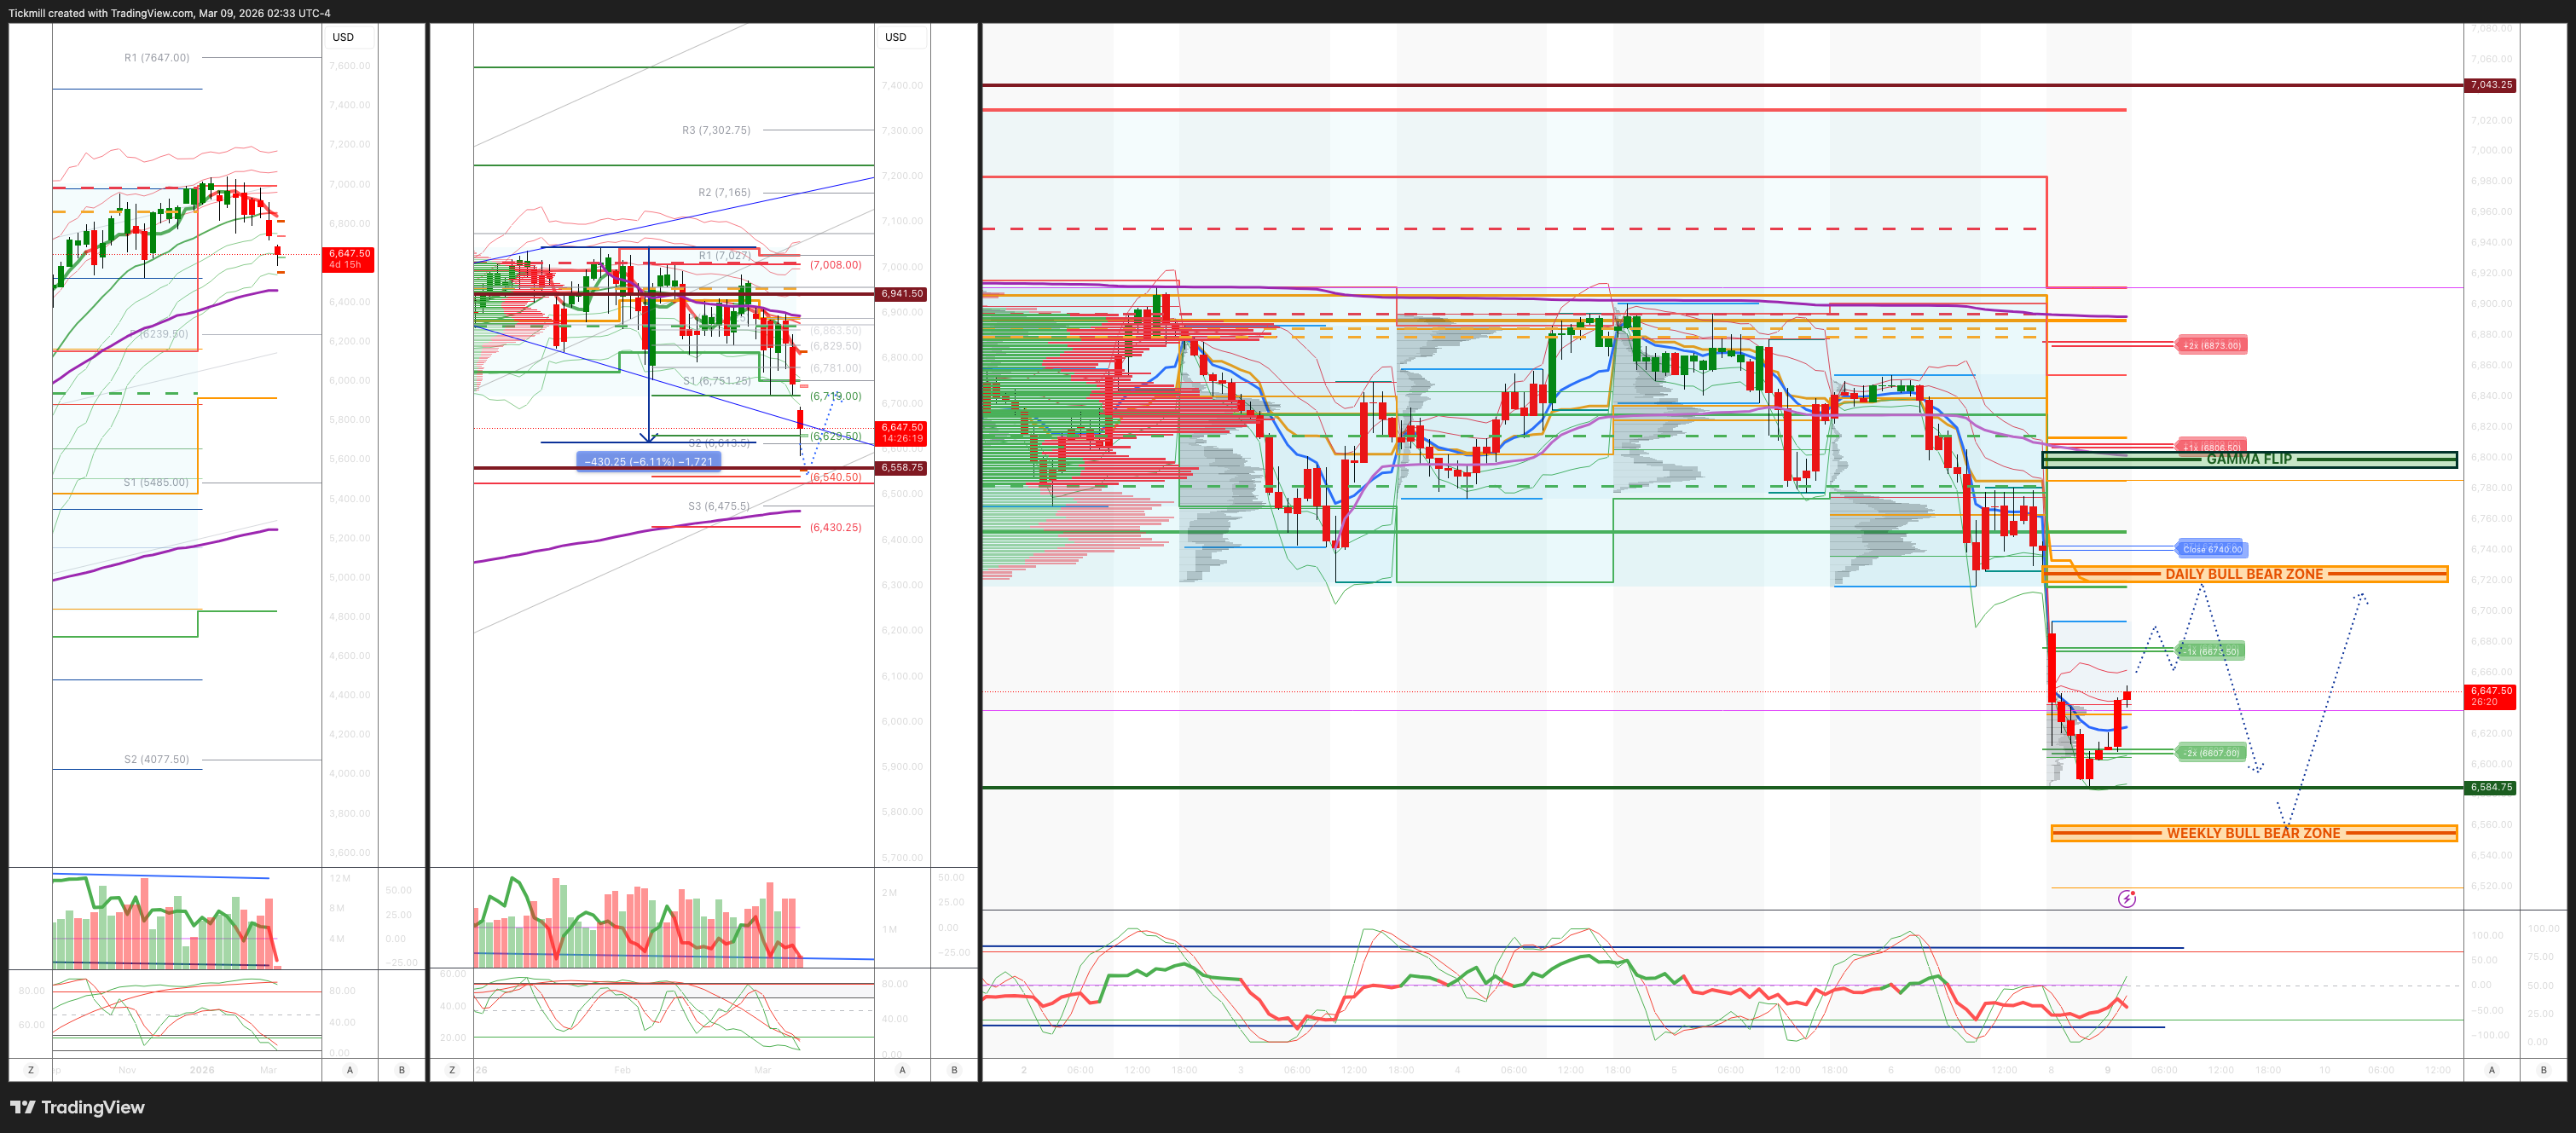
WEEKLY & DAILY LEVELS
***QUOTING ES1! FOR CASH US500 EQUIVALENT LEVELS, SUBTRACT POINT DIFFERENCE***
WEEKLY BULL BEAR ZONE 6560/50
WEEKLY RANGE RES 6942 SUP 6558
Weekly Straddle Range: 192 -point straddle implies a weekly range of [6558, 942]; monitor 1.5x and 2x moves for key reactions.
March OPEX Straddle: 232.8-point range suggests OPEX-to-OPEX movement between [6677, 7142].
March QOPEX Straddle: 368.55-point range projects [6466, 7203], based on December OPEX.
March EOM Straddle: 255.4-point straddle indicates a monthly range of [6623, 7101]. .
DEC2025 to DEC2026 OPEX straddle spans 945 points, outlining a range of [5889, 7779]."
DAILY VWAP BEARISH 6831
WEEKLY VWAP BEARISH 6868
MONTHLY VWAP BEARISH 6889
DAILY STRUCTURE – OTFD - 6780
WEEKLY STRUCTURE – OTFD - 6911
MONTHLY STRUCTURE - OTFD
Balance: This refers to a market condition where prices move within a defined range, reflecting uncertainty as participants await further market-generated information. Our approach to balance includes favouring fade trades at the range extremes (highs/lows) while preparing for potential breakout scenarios if the balance shifts.
One-Time Framing Higher (OTFH): This represents a market trend where each successive bar forms a higher low, signalling a strong and consistent upward movement.
One-Time Framing Lower (OTFD): This describ@es a market trend where each successive bar forms a lower high, indicating a pronounced and steady downward movement.
DAILY BULL BEAR ZONE 6720/30
GAMMA FLIP 6800
DAILY RANGE RES 6891 SUP 6676
2 SIGMA RES 6809 SUP 6609
VIX BULL BEAR ZONE 20
PUT/CALL RATIO 1.25 (The numbers reflect options traded during the current session. A put-call ratio below 0.7 is generally considered bullish, and a put-call ratio above 1.0 is generally considered bearish)
TRADES & TARGETS
LONG ON REJECT/RECLAIM OF DAILY BULL BEAR ZONE TARGET DAILY RANGE RES
LONG ON REJECT/RECLAIM OF DAILY RANGE SUP TARGET DAILY BULL BEAR ZONE
(I FADE TESTS OF 2 SIGMA LEVELS ESPECIALLY INTO THE FINAL HOUR OF THE NY CASH SESSION AS 90% OF THE TIME WHEN TESTED THE MARKET WILL CLOSE ABOVE OR BELOW THESE LEVELS)
GOLDMAN SACHS TRADING DESK VIEW - ‘Oil, Jobs And…’
We may be nearing peak uncertainty, with a broad range of risk scenarios still unresolved. Even so, there remains a view among investors that the conflict could prove relatively short-lived, allowing equities to fade the geopolitical risk premium relatively quickly.
That was initially my own bias, although I have become more cautious given the scale of deployment and the increasing regionalization of the conflict. The nature of this episode — particularly the asymmetry between low-cost drones and high-cost missile defense systems — also makes historical comparisons less straightforward.
Importantly, no major participant appears incentivized to pursue a prolonged conflict. That includes Iran, given its dependence on imports such as livestock feed and vegetable oil, and also Asian economies such as Korea and Japan, which source approximately 80% of their oil from the Middle East, much of it via the Strait of Hormuz.
In terms of market reaction, global equities declined 4% on the week, led by EM, while the NDX fell only 1.3%. Beneath the surface, stress was more visible: VIX rose to ~30, the rotation out of US cyclicals was the largest since Liberation Day, the GS TMT Momentum Pair fell 12% in its worst week in over four years, US HF vs. Most Short declined 7%, and KOSPI dropped 11.5%.
US desk flows were highly consistent with macro-led trading in thin liquidity. ETF volume exceeded 40% of tape, while ETF shorts rose 8.3%, the second-largest increase in five years, indicating a meaningful rise in hedging activity. Long-only investors remained largely inactive, and the SPX break below the CTA medium-term trend level of 6762 is likely to increase systematic supply into next week. Even so, there were no obvious signs of forced liquidation, panic, or capitulation.
More broadly, the market is expanding from a single AI-led narrative to a wider set of concerns, including oil shock, stagflation risk, geopolitical spillovers, and private credit stress. The cross-currents were evident this week: gold was lower, while IGV closed higher in all five sessions, and US Software vs. Semis rose 17%. The message is clear: positioning is dominating fundamentals in the near term, and momentum/crowded longs remain a likely source of supply in this volatility regime.
2/ Implications, sensitivity, and scenarios
We are raising our 2Q Brent forecast by $10 to $76/bbl, while maintaining a year-end view of $66/bbl as the current geopolitical risk premium normalizes. In the near term, however, risks are firmly skewed to the upside. If there is no closure, Brent could trade above $100/bbl as early as next week.
If Strait of Hormuz flows remain depressed through March, we now believe it is increasingly likely that oil prices — especially refined products — would exceed the highs seen in both 2008 and 2022.
The macro impact would be meaningful. At current levels, we estimate a 10bp drag on global growth and a 20bp increase in global inflation. At $100/bbl, those effects rise to 40bp and 70bp, respectively. We provide detailed sensitivities for the US, Europe, and EM Asia.
From an equity perspective, earnings sensitivity also becomes increasingly relevant. One of the more interesting historical comparisons is the pattern of SPX drawdowns in prior geopolitical shock episodes. The initial first-week decline of roughly -4% is consistent with this week’s move, although the subsequent drawdown path has historically been shallower than one might assume.
US stocks are trending lower on Friday, with the S&P 500 on track for a ~2% decline this week (as of 2:50 PM). Investors are grappling with surging oil prices following Middle East energy supply disruptions, a weaker-than-expected Payrolls report, and renewed concerns about the potential return of stagflation.
The markets are currently dealing with a range of factors, but oil appears to be the dominant driver for now. The latest Payrolls report revealed a significant slowdown, with non-farm Payrolls dropping by 92,000 and the unemployment rate rising to 4.4%. This weaker employment data, signaling slower economic growth, has put downward pressure on 10-year Treasury yields, which are now ~5 basis points lower than before the report's release.
Meanwhile, the AI disruption narrative continues to gain momentum. Ronnie Walker has highlighted how several companies reporting earnings in recent months have cited cost savings due to AI advancements in "Earnings Season Takeaways: AI-nxiety." Gabriela Borges also noted the progress of AI tools like Claude Cowork and OpenClaw, which are enhancing active user interfaces and accelerating the adoption of AI as a general intelligence layer in software, as discussed in "Software: Revisiting Moats II: Datapoints on General Intelligence Tools."
However, oil remains the central focus this week. Around 20% of the global oil supply flows through the Strait of Hormuz, a critical chokepoint near Iran. The ongoing conflict that escalated last weekend has significantly disrupted these supplies. Daan Struyven's March 4 update, "Oil: Raising Our Price Forecast on Lower OECD Inventories Amidst Hormuz Disruptions," outlines the impact of these developments.
Front-month Brent crude oil has surged by ~$20 per barrel this week, nearing $92 per barrel, as the energy market faces a major supply squeeze. Similarly, Dutch natural gas (TTF) prices have jumped nearly 50% this week due to supply shutdowns in Qatar. In light of these events, experts from the Commodities research team, including Daan Struyven and Sam Dart, along with Farouk Sousa and Alec Philips from the economics team, convened to discuss the implications. Their insights are detailed in "Research Unplugged: The Middle East & Risks to Energy Prices: Views from Research & Trading.".
Bottom-line: Time is critical in a market with limited inventory and continuous demand, such as oil and gas. Goldman Sachs engages in business with companies covered in its research reports, which may pose a conflict of interest impacting the objectivity of this report. Investors are advised to consider this report as one factor among many in their investment decisions. For Reg AC certification and other disclosures, refer to the Disclosure Appendix or visit www.gs.com/research/hedge.html. Note that analysts employed by non-US affiliates are not registered/qualified as research analysts with FINRA in the U.S.
On Wednesday, Goldman Sachs raised its 2Q26 average Brent oil forecast by $10, assuming five additional days of significantly reduced (15% of normal) Strait of Hormuz (SoH) exports, followed by a gradual recovery over 28 days. This projection only extends into early next week. Additionally, Jerome Dortmans, co-head of Global Oil & Products Trading at GS Global Banking & Markets, shared insights on how commodity markets are adapting to the disruption and potential future developments during a discussion captured in the weekly podcast, “The Markets: $120 Oil Ahead?”
In equity markets, Energy has been the best-performing sector within the S&P 500 this week, as investors anticipate prolonged higher pricing for products such as gasoline, diesel, and jet fuel. Surprisingly, Technology has been the second-best performing sector, with half of the Tech stocks in the S&P 500 trading higher this week. Software stocks like CRWD, NOW, INTU, and WDAY led the rebound, as investors reconsider the value of stocks tied to the economic cycle versus those traditionally exhibiting defensive growth traits. Gabriela Borges emphasized the potential for legacy software platforms to support increasingly user-friendly AI-driven applications, noting that proving this potential could be key to sustaining the current rally.
Against this backdrop, Peter Oppenheimer suggested in his Global Strategy note, “Equities vulnerable to correction, but not a bear market,” that while a stock market correction is possible, a bear market remains unlikely. Meanwhile, Dominic Wilson and Kamakshya Trivedi explored various areas of market exposure and shelter across the capital structure in their note, “Market Thoughts Following the Strikes in Iran.” Their discussion on the evolving geopolitical landscape was featured in a 30-minute podcast, “Research Unplugged: Global Markets: Cyclical Tailwinds, Valuation Headwinds & an Evolving Geopolitical Backdrop.”
The VIX reached 27 this week, its highest level since last April’s Liberation Day. Last year, the economy and markets absorbed significant challenges, including spikes in U.S. import tariffs, immigration reform, subsidy cuts, and federal downsizing. This year, while fiscal stimulus from last July’s budget bill tax cuts is expected to bolster the economy, higher oil prices are raising concerns about inflation and growth. Despite these challenges, the U.S. economy and consumer have shown resilience in the post-pandemic echo-boom. The question remains: can the U.S. maintain this resilience?
The Long Good-bye?
Fourteen years ago, Peter Oppenheimer published a seminal post-GFC strategy paper, “The Long Good Buy; the Case for Equities.” He argued that the potential returns for equities relative to bonds were the strongest in a generation due to spiked risk premia and the likelihood of moderation, paving the way for steady equity growth in subsequent years. This week, Oppenheimer released a new note, “Equities vulnerable to correction, but not a bear market,” highlighting that strong economic and corporate earnings growth, alongside healthy private sector balance sheets, could support stocks once current risks subside. However, high valuations have made equities more susceptible to concerns over oil and gas supply disruptions and their inflationary impact. Notably, equity risk premia have dropped significantly, returning to levels seen prior to the financial crisis.
Disclaimer: The material provided is for information purposes only and should not be considered as investment advice. The views, information, or opinions expressed in the text belong solely to the author, and not to the author’s employer, organization, committee or other group or individual or company.
Past performance is not indicative of future results.
High Risk Warning: CFDs are complex instruments and come with a high risk of losing money rapidly due to leverage. 69% and 73% of retail investor accounts lose money when trading CFDs with Tickmill UK Ltd and Tickmill Europe Ltd respectively. You should consider whether you understand how CFDs work and whether you can afford to take the high risk of losing your money.
Futures and Options: Trading futures and options on margin carries a high degree of risk and may result in losses exceeding your initial investment. These products are not suitable for all investors. Ensure you fully understand the risks and take appropriate care to manage your risk.
Patrick has been involved in the financial markets for well over a decade as a self-educated professional trader and money manager. Flitting between the roles of market commentator, analyst and mentor, Patrick has improved the technical skills and psychological stance of literally hundreds of traders – coaching them to become savvy market operators!